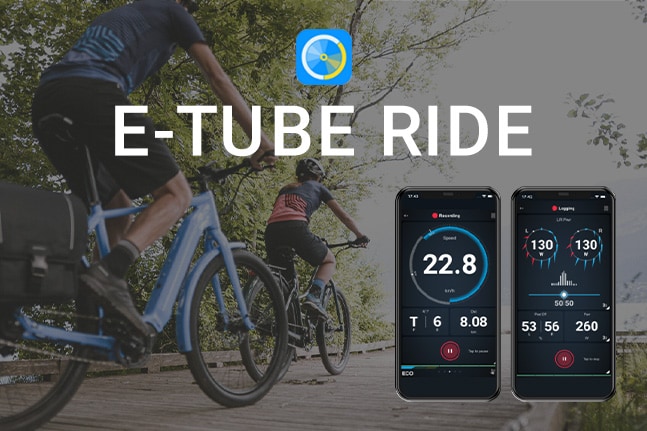
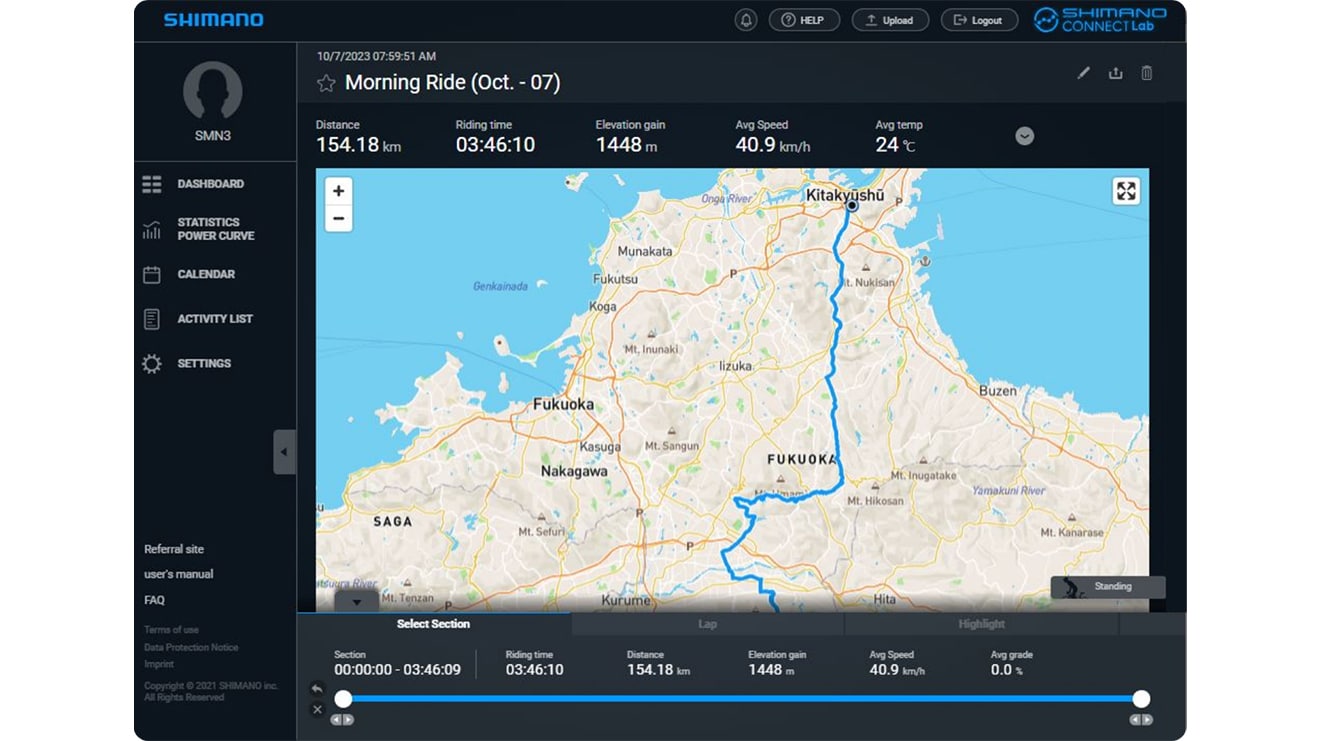
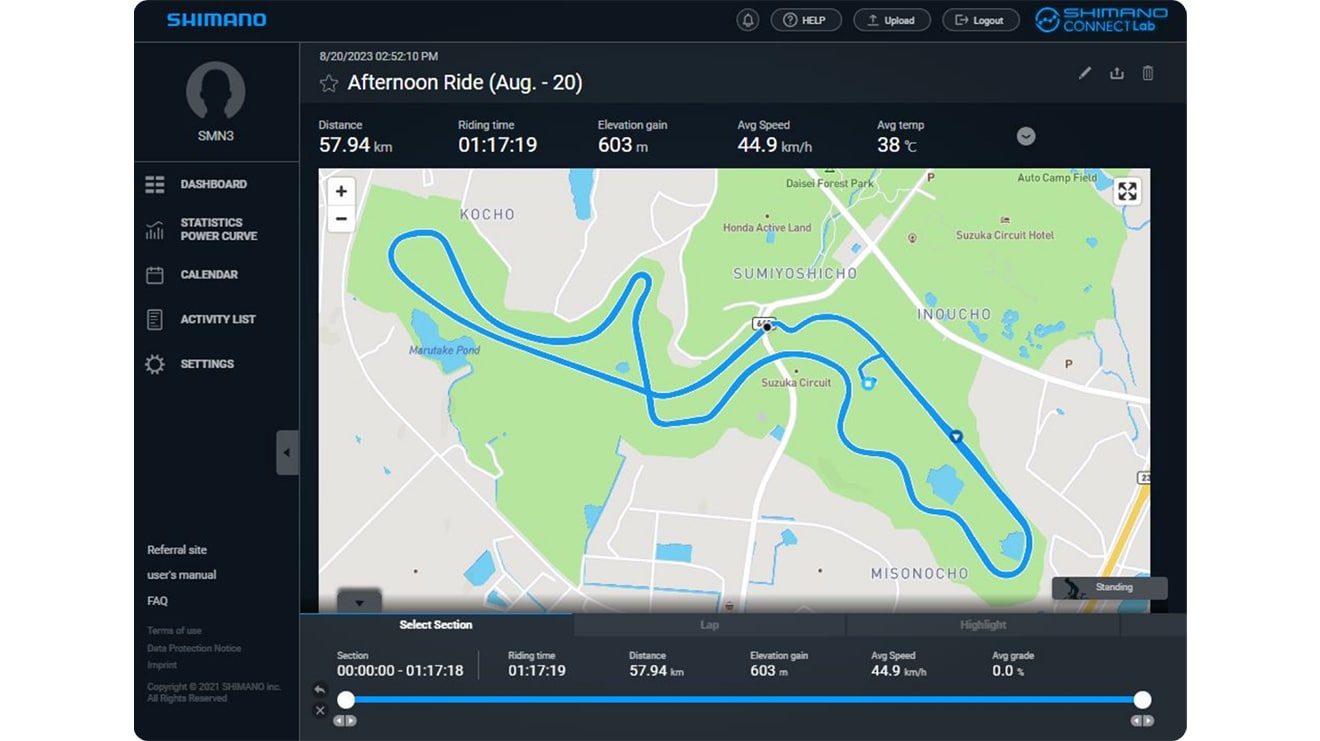
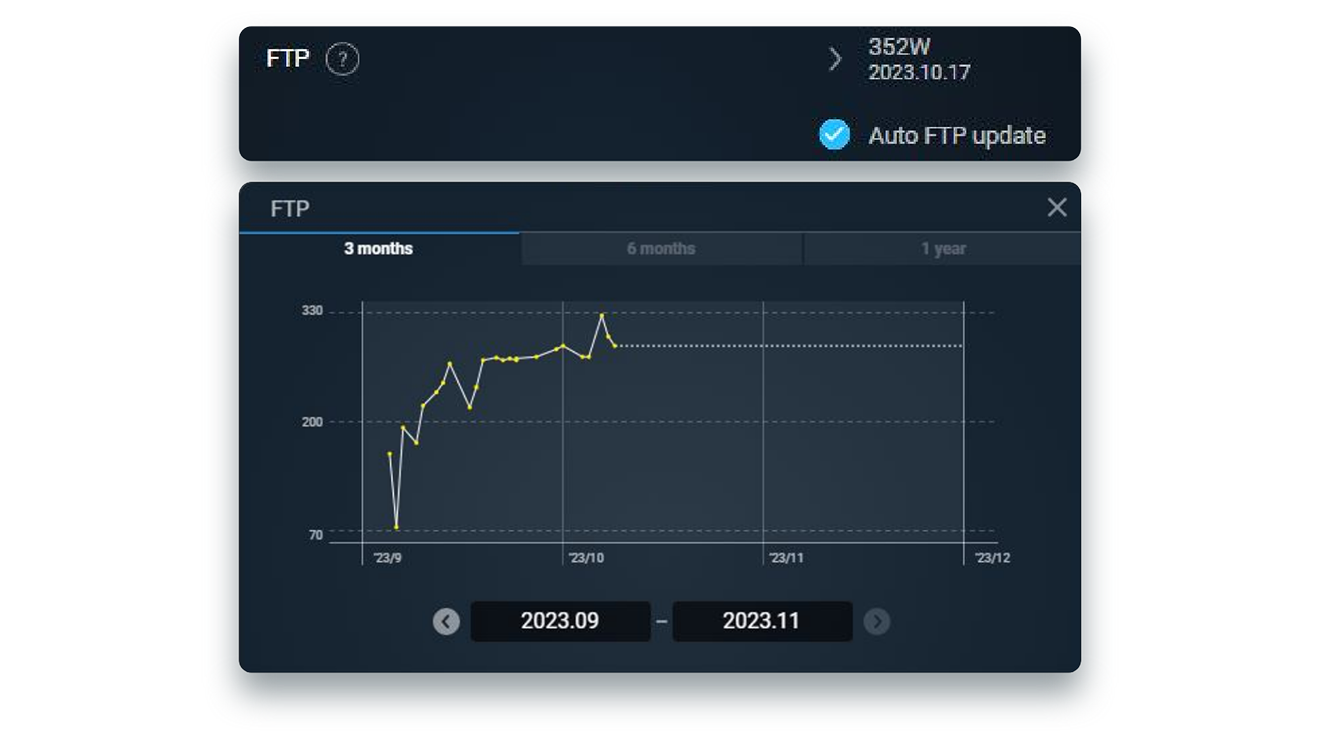
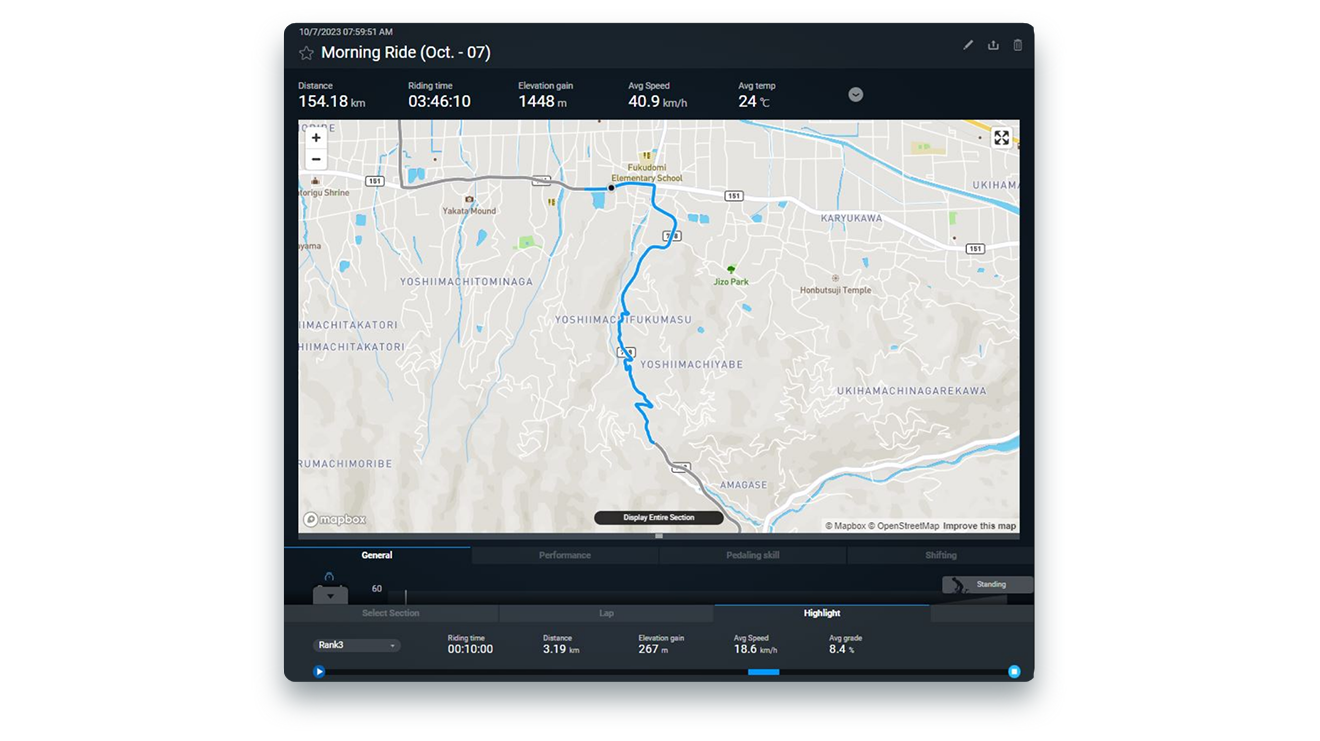
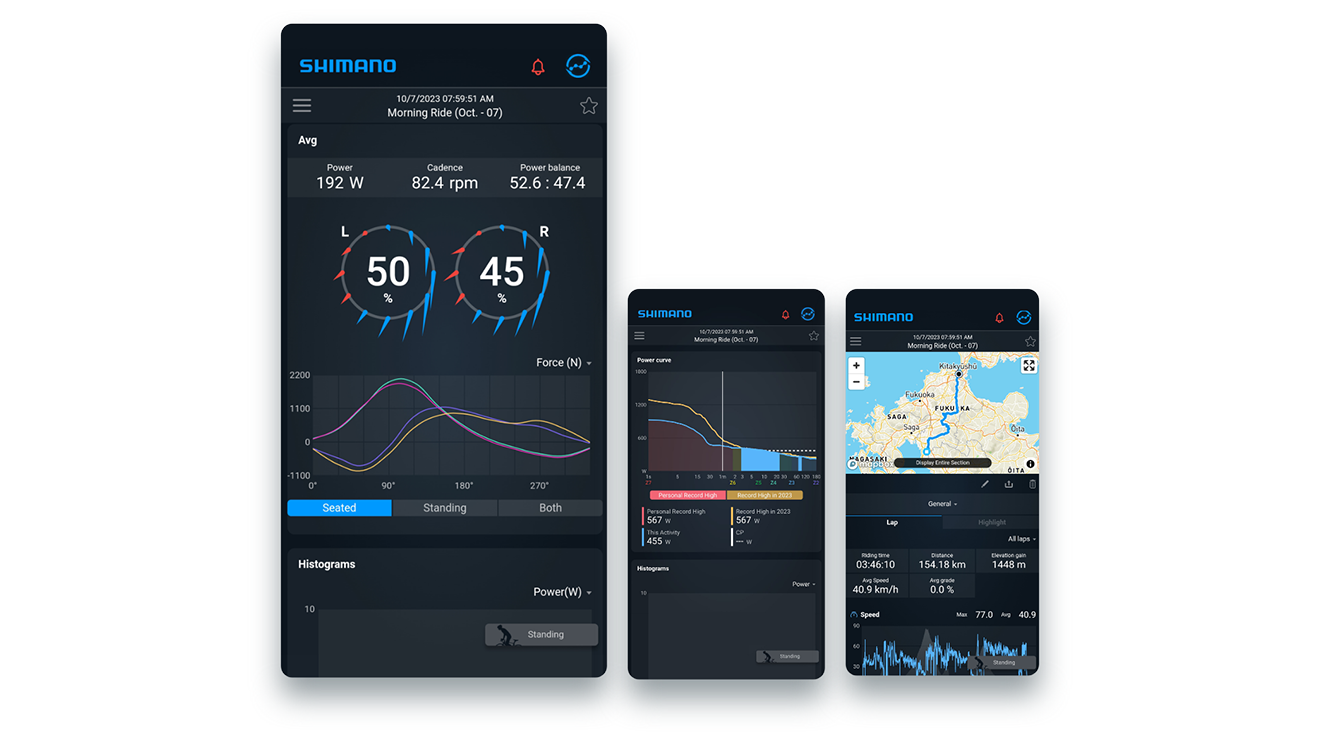
SHIMANO bicycle ride data collection/analysis service

SHIMANO CONNECT Lab helps riders take their training to the next level with advanced visualizations based on riding data linked to their SHIMANO ID.

Sign in / Log in

A SHIMANO ID is required to use SHIMANO CONNECT Lab. Click here to see if SHIMANO ID is available in your area.

Important Notice

  • 2024/06/19
    It has been confirmed that there are cases where the application gets stuck on the loading screen and does not open after login. Please try "Reload this page" or "Refresh" on your browser.

Elevate your performance with powerful visualizations.

Force Vector Analysis

Increase pedaling efficiency with insightful post-ride visuals and analysis


Visualizing both power and force vectors makes it easier to understand the quality of your pedaling, revealing opportunities for enhancing power.


Analyzing force vector visualizations can help riders understand their pedaling traits and gain valuable insights for improving efficiency.


Riders can also use the charts to identify pedaling imbalances in left-right output and make changes to improve pedaling stability.

Gear Shifting Visualization

Visualizes gear shifting to support optimal gear selection


After a ride, you can clearly see if you maintained your target cadence by selecting the optimal gear for each change in terrain.


This data can be used to select the optimal numbers of cassette tooth and front chainring tooth set for the course and pedal force.

Power Curve Analysis

Dominate every ride with power curve in sight.


Instantly identify your power traits from the power curve, revealing critical areas for improvement.


Confirm if your training efforts deliver the desired results by assessing effectiveness and efficiency.


Whenever you set a new personal record for the year in the displayed activity, it will be highlighted in light blue.

Riding Data in Action

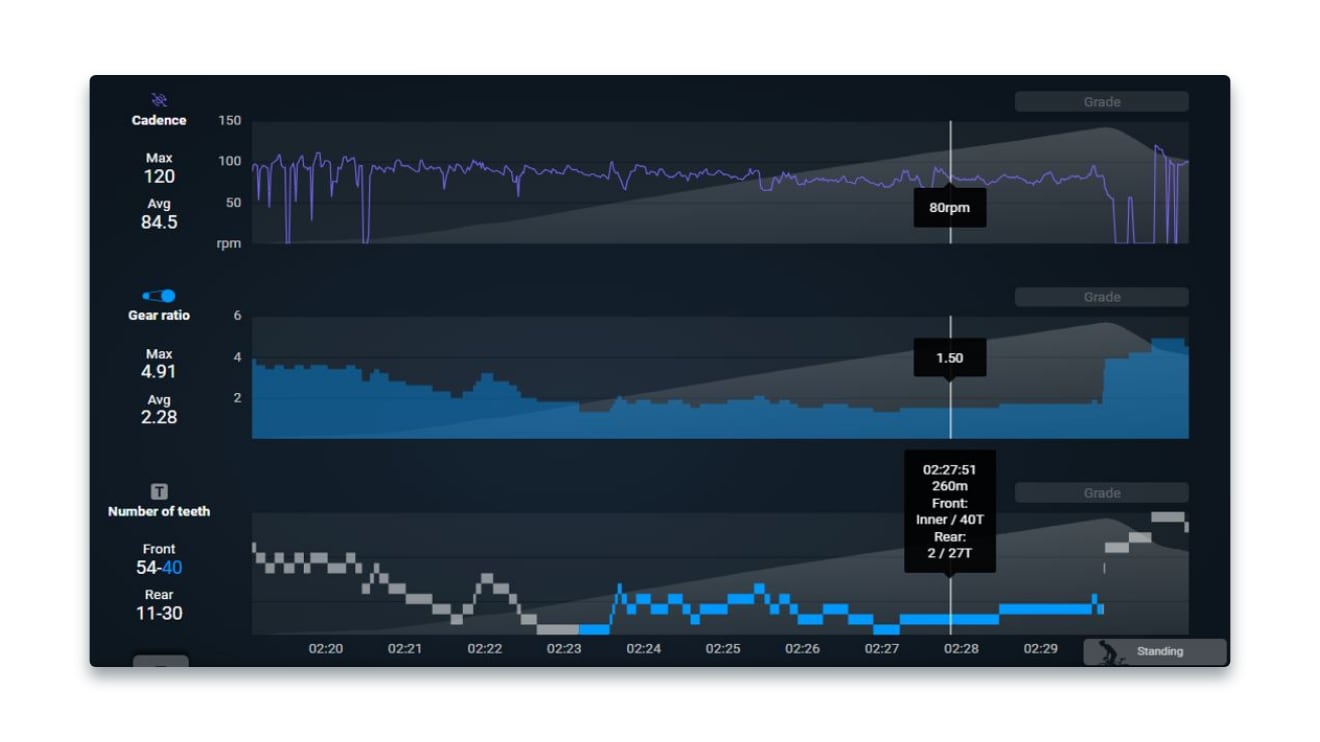
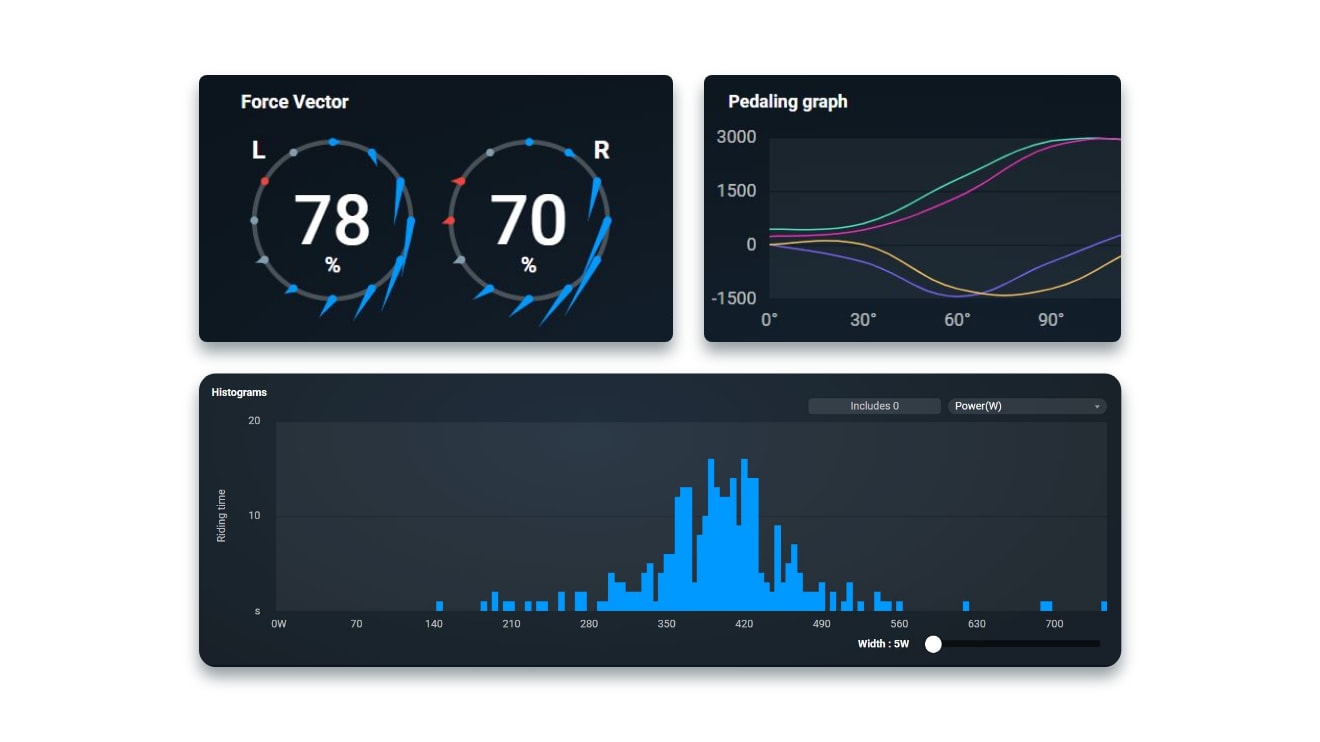
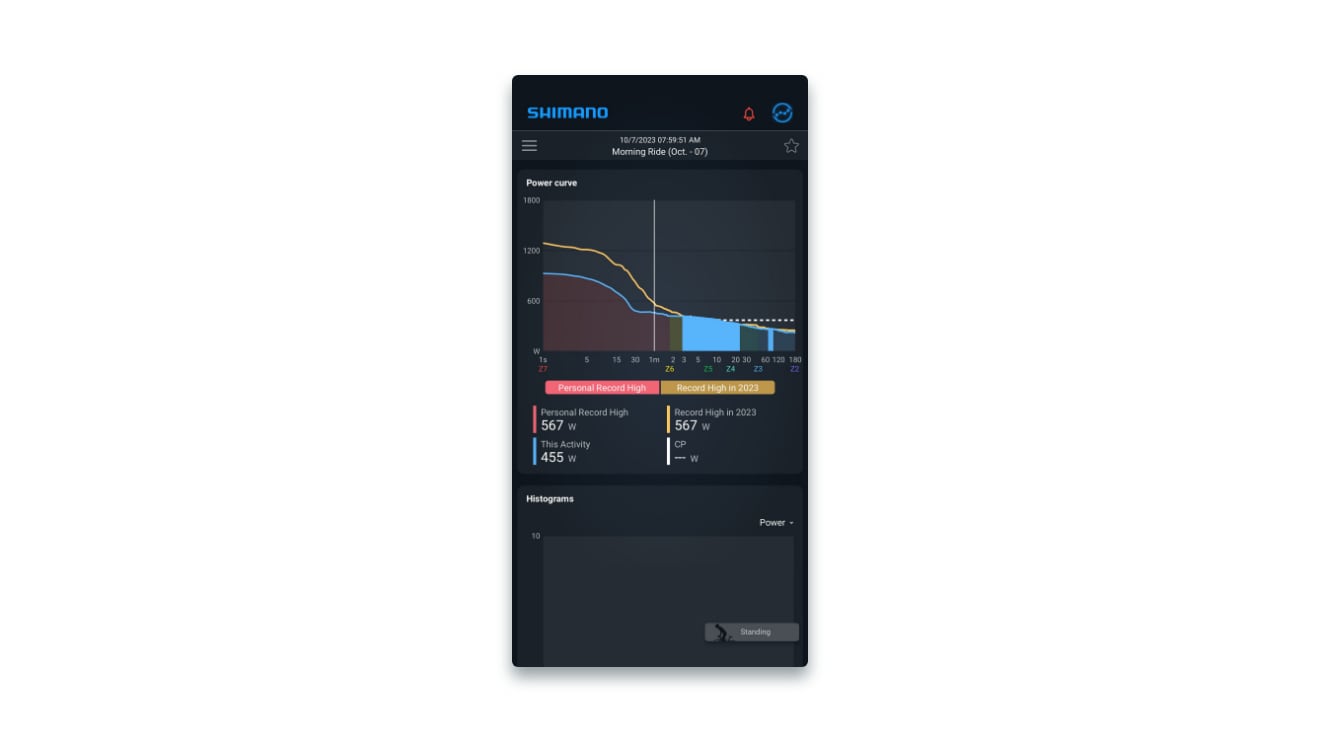
Discover the power of post-ride analysis on SHIMANO CONNECT Lab with these real-world examples from professional riders.

See how this skilled rider sustains impressive pedaling efficiency even as they reach the end of a 150-kilometer road race.

Marvel at this professional rider's explosive uphill goal sprint in a closed-circuit race.

New Features

*These new features were added in the June 2024 update.

Automatic FTP* Updates

Automatically assesses and updates your FTP (Functional Threshold Power) using your power curve so you can more precisely evaluate your training efforts.

*Functional Threshold Power is the highest average number of watts a rider can sustain for an hour.

Highlight

Intervals where you recorded the highest output are displayed on the map in descending order so you can see if you pushed yourself hard enough in each segment.

Better smartphone experience

More content can now be viewed in a mobile browser for an experience closer to using a PC display.

You can view each activity's force vectors, gear shifting, power curves, etc.

Seamless data integration with other services

Get more from your riding data by transferring it to/from other services.

Import Activities

Activities uploaded to linked third-party services can be displayed on SHIMANO CONNECT Lab.

Export Activities

Riding data uploaded to SHIMANO CONNECT Lab can be transferred to linked third-party services.

News

  • 2024/06/19

    It has been confirmed that there are cases where SHIMANO CONNECT Lab gets stuck on the loading screen after login.
    If this occurs, please try the following steps.

    - Click the "Reload this page" or "Refresh" icon on your browser or press the F5 key on your keyboard to reload the screen.
    - The "Please log in again." dialog appears on the screen. Click OK.
    - The SHIMANO CONNECT Lab top page is displayed. Click "Log in with your SHIMANO ID".
    - Enter your login information to log in.
    - The SHIMANO CONNECT Lab dashboard is displayed.

    We apologize for the inconvenience. Thank you for your understanding and cooperation.

  • 2024/06/13

    SHIMANO CONNECT Lab has been updated.
    ■ New features
    - By adding the Highlight function, intervals where intensity was higher than the athletic ability of the cyclist can now be automatically extracted from one ride data.
    - The auto FTP update function has been added. When your most recent ride data is uploaded, your estimated FTP at the time is now calculated and automatically updated.
    - A function that automatically creates statistics/power curve season data has been added. The period from January 1st to December 31st is now automatically grouped as one season.
    ■ Changes
    - The method for calculating riding data has been updated.
    - The activity analysis screen has been redesigned.

  • 2024/03/12
    Because the Today's Plan service offered by Today’s Plan Pty Ltd has ended, ride logs are no longer exported from SHIMANO CONNECT Lab.
  • 2023/04/25

    ・ The Force Vector Viewer app for Garmin now supports Edge® 840, Edge® 840 solar, Edge® 540 and Edge® 540 solar.
    Click here for the installation procedure.

  • 2023/01/18

    ・ The Force Vector Viewer app for Garmin now supports Edge® 1040 and Edge® 1040 solar.
    Click here for the installation procedure.

  • 2021/07/26

    ● Regarding the ride data transfer to external services where web links are set up, the following issues have been resolved.

    ・Transfer to STRAVA fails.
    To submit the data again, perform. the step "(4) Post".

    ・Transfer fails when multiple files are selected on Activity List.
    Click here for details.

  • 2021/07/09

    ● The time to analyze ride data (.FIT file) uploaded from non-Pioneer cycle computers has been reduced.

  • 2021/06/30
    Our new web service "SHIMANO CONNECT Lab" has been launched.