
SHIMANO bicycle ride data collection/analysis service
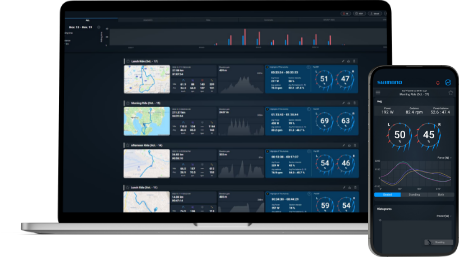
SHIMANO CONNECT Lab helps riders take their training to the next level with advanced visualizations based on riding data linked to their SHIMANO ID.
Sign in / Log inA SHIMANO ID is required to use SHIMANO CONNECT Lab. Click here to see if SHIMANO ID is available in your area.
Elevate your performance with powerful visualizations.
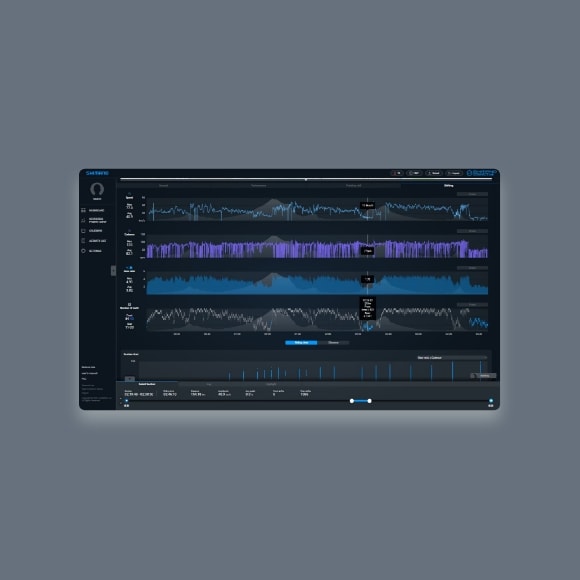
Riding Data in Action
Discover the power of post-ride analysis on SHIMANO CONNECT Lab with these real-world examples from professional riders.
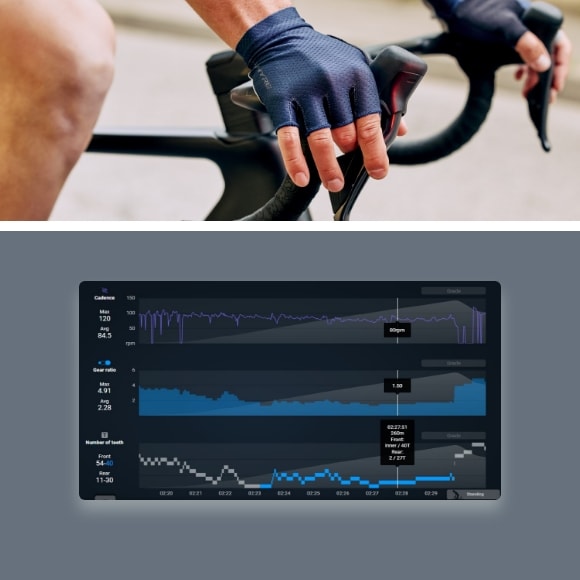
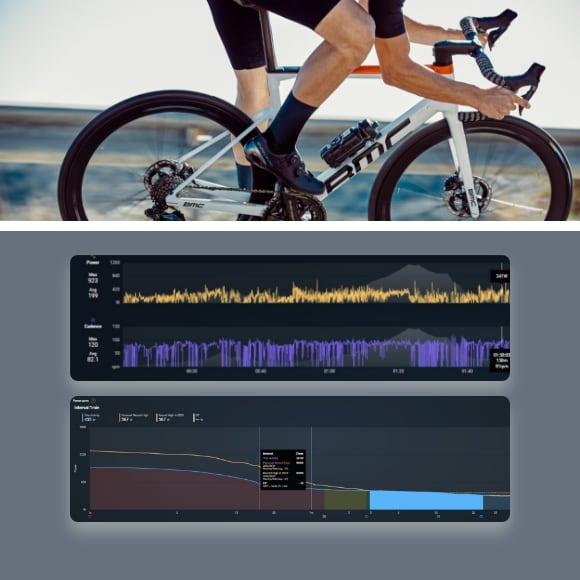
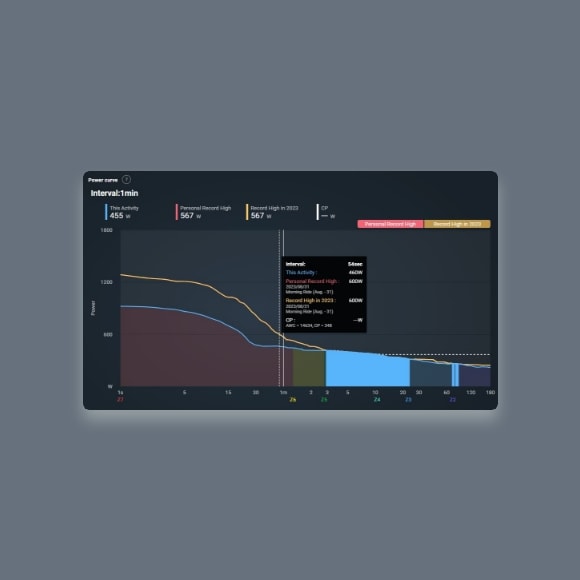
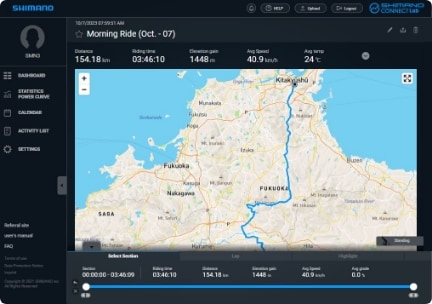
See how this skilled rider sustains impressive pedaling efficiency even as they reach the end of a 150-kilometer road race.
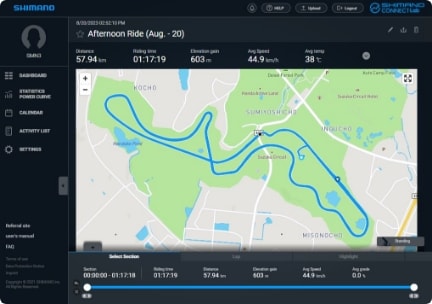
Marvel at this professional rider's explosive uphill goal sprint in a closed-circuit race.
New Features
*These new features were added in the June 2024 update.
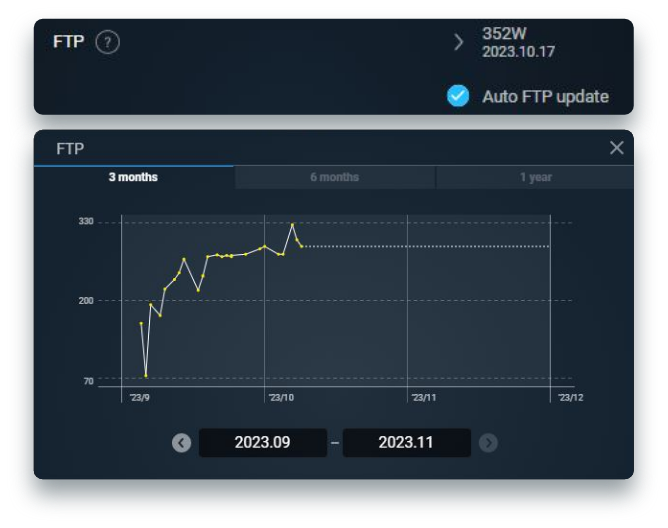
Automatic FTP*Updates
Automatically assesses and updates your FTP (Functional Threshold Power) using your power curve so you can more precisely evaluate your training efforts.
*Functional Threshold Power is the highest average number of watts a rider can sustain for an hour.
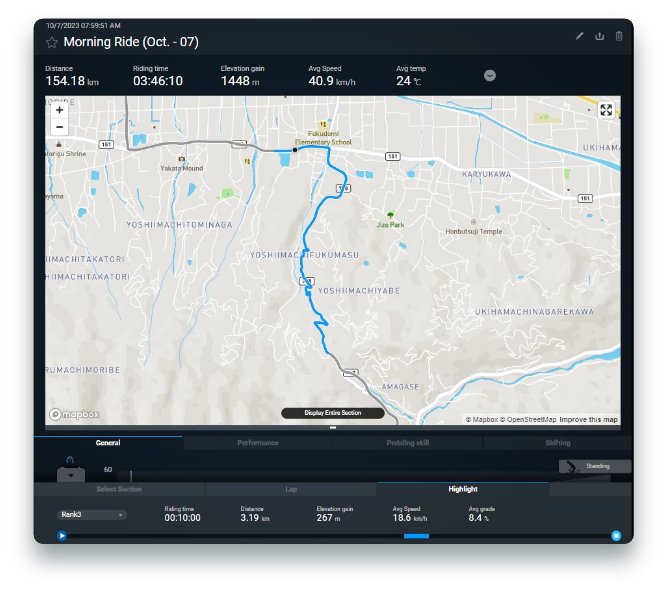
Highlight
Intervals where you recorded the highest output are displayed on the map in descending order so you can see if you pushed yourself hard enough in each segment.
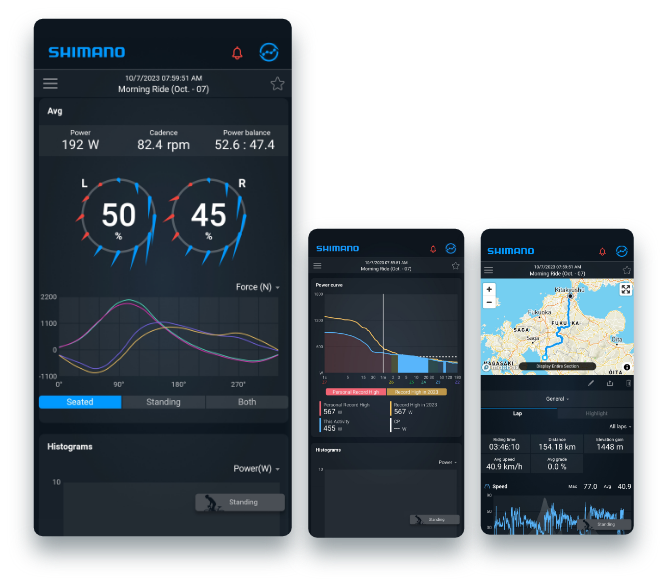
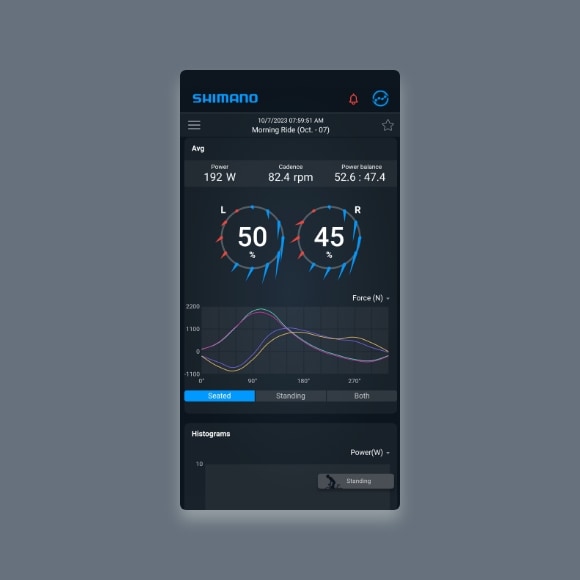
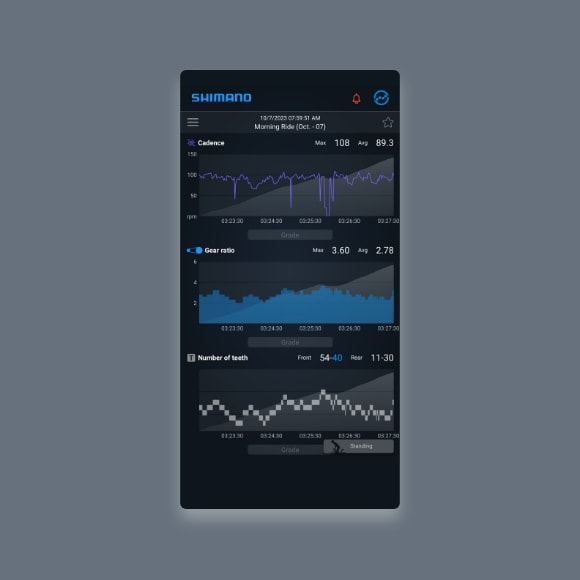
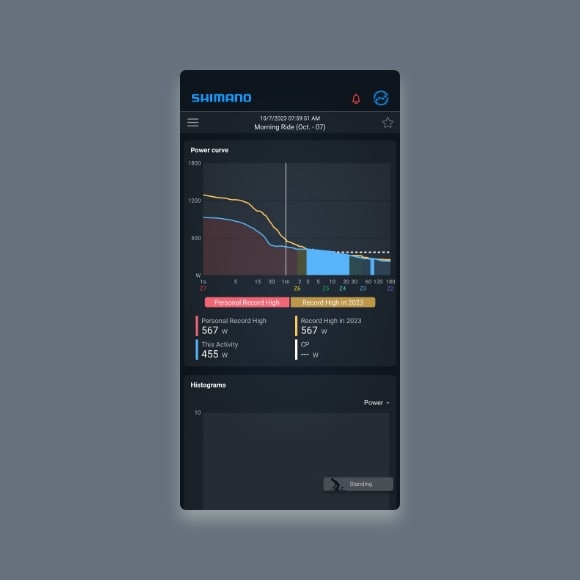
Better smartphone experience
More content can now be viewed in a mobile browser for an experience closer to using a PC display.
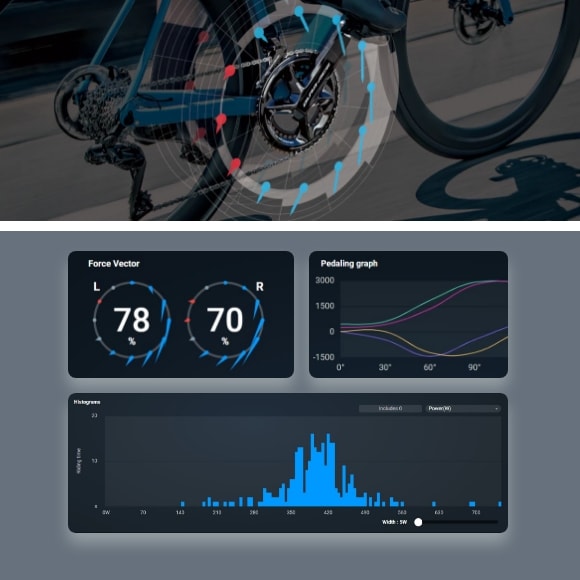
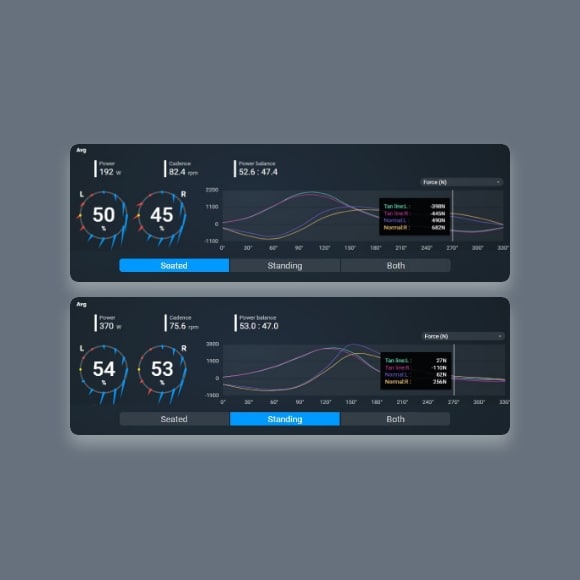
You can view each activity's force vectors, gear shifting, power curves, etc.
Seamless data integration with other services
Get more from your riding data by transferring it to/from other services.
Import Activities
Activities uploaded to linked third-party services can be displayed on SHIMANO CONNECT Lab.


Export Activities
Riding data uploaded to SHIMANO CONNECT Lab can be transferred to linked third-party services.


Related Links
 E-TUBE RIDE
 POWER METER TECHNOLOGY
Notícias
-
2024/06/19
It has been confirmed that there are cases where SHIMANO CONNECT Lab gets stuck on the loading screen after login.
If this occurs, please try the following steps.- Click the "Reload this page" or "Refresh" icon on your browser or press the F5 key on your keyboard to reload the screen.
- The "Please log in again." dialog appears on the screen. Click OK.
- The SHIMANO CONNECT Lab top page is displayed. Click "Log in with your SHIMANO ID".
- Enter your login information to log in.
- The SHIMANO CONNECT Lab dashboard is displayed.We apologize for the inconvenience. Thank you for your understanding and cooperation.
-
2024/06/13
SHIMANO CONNECT Lab has been updated.
■ New features
- By adding the Highlight function, intervals where intensity was higher than the athletic ability of the cyclist can now be automatically extracted from one ride data.
- The auto FTP update function has been added. When your most recent ride data is uploaded, your estimated FTP at the time is now calculated and automatically updated.
- A function that automatically creates statistics/power curve season data has been added. The period from January 1st to December 31st is now automatically grouped as one season.
■ Changes
- The method for calculating riding data has been updated.
- The activity analysis screen has been redesigned. -
2024/03/12Uma vez que o serviço Today's Plan oferecido pela Today's Plan Pty Ltd terminou, os registos de percurso já não são exportados do SHIMANO CONNECT Lab.
-
2023/04/25
・ O aplicativo Force Vector Viewer para Garmin agora suporta Edge® 840, Edge® 840 solar, Edge® 540 e Edge® 540 solar.
Clique aqui para o procedimento de instalação. -
2023/01/18
・ O aplicativo Force Vector Viewer para Garmin agora suporta Edge® 1040 e Edge® 1040 solar.
Clique aqui para o procedimento de instalação. -
2021/07/26
● Em relação à transferência de dados de viagem para serviços externos onde são fornecidas ligações, foram resolvidos os seguintes problemas.
・Falha ao fazer transferências para STRAVA.
Para enviar os dados novamente, execute o passo "(4) Publicar".・A transferência falha quando são selecionados vários ficheiros na Lista de Atividades.
Clique aqui para mais detalhes. -
2021/07/09
● O tempo para analisar os dados da viagem (ficheiro .FIT) carregados de computadores que não são de ciclismo da Pioneer foi reduzido.
-
2021/06/30Foi lançado o nosso novo serviço web "SHIMANO CONNECT Lab".